TL;DR
- The analysis was performed on 49,029,763 cold email verification records.
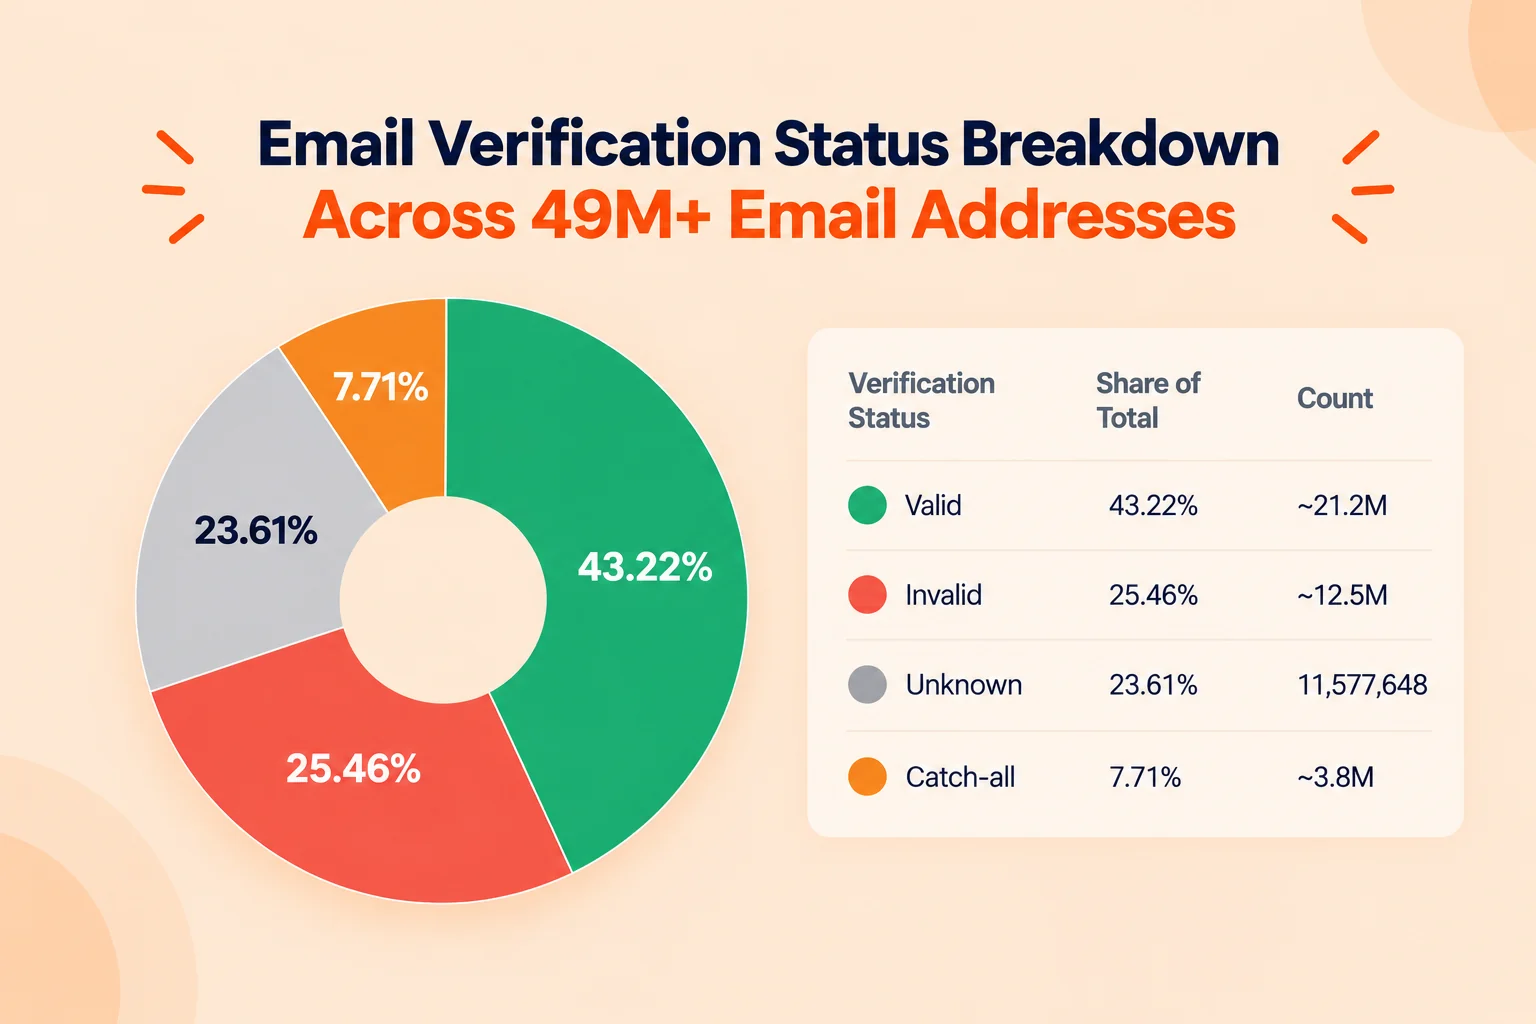
- The percentages for all addresses were 43.22% valid, 25.46% invalid, 7.71% catch-all, and 23.61% unknown at the mailbox level.
- 29.31% of addresses were safe to send, 21.77% were risky and 25.34% were not safe.
- 36.8% of the email addresses submitted were from a free email provider, while 63.2% came from a business or custom domain.
- Role-based addresses accounted for 1.5% and disposable were 0.13%, while gibberish addresses were 8.4%.
- It can serve as the benchmark for email deliverability statistics 2026.
Cold email statistics in 2026 show that many lists of email addresses are not ready to use for cold email outreach campaigns. I'm saying this because our initial verification of 49 million addresses yielded only about 29% of addresses that returned as safe to send status. The rest were bad, had risky, catch-alls or just not possible to verify with traditional methods.
It matters because teams find out about these numbers when the email deliverability rate goes below 70% and the campaign doesn't go as well as they had hoped.
The cold email statistics below clearly illustrate where the risk lies in your email list. Let's dive in!
What Do The Cold Email Deliverability Statistics 2026 Show Overall?
This cold email data report shows that about 1/4th of all the addresses sent for verification are invalid or unverifiable. We identified all the verification events from August 18 to September 16, 2026 and subsequently determined the valid, invalid, unknown, and catch-all email rates.
| Verification Status | Share of Total | Count |
|---|---|---|
| Valid | 43.22% | ~21.2M |
| Invalid | 25.46% | ~12.5M |
| Unknown | 23.61% | 11,577,648 |
| Catch-all | 7.71% | ~3.8M |
A quarter of all addresses returned unknown, which means the receiving mail server would not confirm or deny the mailbox at the point of check. That is not the same as invalid.
Typically, it is caused by greylisting, rate limiting, or a mail server that blocks verification pings, and is one of the most misinterpreted numbers in any set of cold email deliverability benchmarks.
- When the validated rate is less than 40%, send it through an email verifier before sending for cold outreach. It's most likely that you have a purchased or long-unverified list.
- Before discarding unknown addresses, use a deeper verification pass, like Clearout's Deep Verify for catch-all detection and SMTP retry logic.
Only 29.31% of Cold Email Addresses Are Safe to Send
29.31% of all the addresses in this data set were marked as safe to send. The safe to send is a more rigorous criteria because it also covers catch-all risk, spam trap patterns, and mailbox activity signals.
| Safe to Send Verdict | Share of Total |
|---|---|
| Safe (yes) | 29.31% |
| Risky | 21.77% |
| Not safe (no) | 25.34% |
| Unknown | 23.58% |
Safe to Send Verdict Across 49M+ Addresses
Less than 1/3 of recipients of a raw list would be truly safe targets. The other 7 of the 10 have some degree of bounce, complaint, or deliverability risk.
Where does your list stand? Use this benchmark tier table to find out:
| List Quality Tier | Safe to Send Rate | What It Means |
|---|---|---|
| Clean list | 50% or above | Verified recently, low catch-all exposure |
| Average unverified list | 25% to 35% | Matches this dataset's 29.31% baseline |
| High-risk list | Under 20% | Purchased, scraped, or long unverified |
Before launching your next campaign, review these best practices for cold email outreach to help you reach relevant prospects without putting your sender reputation at risk.
- STOP the campaign if your safe-to-send rate is below 25%. Run the list first with Clearout Email Verifier. Sending at this level can cause Gmail's and Yahoo's 2% bounce enforcement to be triggered.
- 25% to 35% is the average for unverified outreach lists. You will be pushed into the "clean" tier if you verify it.
- A safe-to-send rate of 50% or more is a good sign. Email addresses can change, so recheck lists that are more than 90 days old.
Free vs. Business Email Addresses: What's the Split?
Around 37% of the addresses came from free email services, while 63% used business domains. This split helps you understand how free and business email accounts handle your messages.
| Address Type | Share of Total | Volume |
|---|---|---|
| Free provider | 36.8% | 18,054,840 |
| Business or custom domain | 63.2% | ~30,974,923 |
Free vs. Business Email Addresses
We did not break the free segment down by individual providers, such as Gmail versus Outlook versus Yahoo, in this release, since that level of detail needs a separate data pull. We plan to cover provider level splits in a follow up report.
What we can say from this is that over a third of cold outreach volume still goes to free inboxes, which typically apply stricter bulk sender filtering than a company's own mail server.
- Segment your free and business addresses into separate send groups. Even with a clean list, Gmail and Yahoo may send some of your campaign emails to spam.
- Monitor spam complaint rates separately for free and business segments. A complaint rate above 0.10% from Gmail inboxes triggers Google's enforcement threshold and affects all future sends from your domain.
- Send fewer cold emails per day to free inboxes and give your domain more time to warm up.
Gibberish Addresses Were 65 Times More Common Than Disposable
Disposable addresses were rare in this dataset at 0.13%, but gibberish and role based addresses showed up far more often. These three properties are measured independently of valid or invalid status, so an address can be valid and still carry one of these flags.
| Property | Share Flagged Yes | Volume |
|---|---|---|
| Free | 36.8% | 18,054,840 |
| Gibberish | 8.4% | 4,125,634 |
| Role based | 1.5% | 751,554 |
| Disposable | 0.13% | 61,947 |
Address Properties Flagged
Gibberish addresses, things like random character strings or clearly fake inputs, were nearly 65 times more common than disposable addresses in this sample. That is a useful number if you are trying to decide where to focus list hygiene effort. Catching gibberish and role based inputs at the point of form or list entry prevents more waste than disposable detection alone.
How Does Cold Email Verification Volume Change Day to Day?
Verification volume moved between roughly 390,000 and 2.87 million records per day across the 30 day window, averaging 1.63 million per day. The highest single day volume landed on August 18, with additional peaks in the first week of September.
What we tested
We wanted to know whether cold email sending activity follows a predictable weekly rhythm or spikes randomly around specific campaign dates, using our own verification traffic as a proxy for active sending behavior.
How we tested it
We pulled per day verification counts from the clearout-ev Elasticsearch index for the full 30 day window and plotted them against the date field verified_on, in UTC.
What we found
Volume dipped noticeably in the final week of August, then climbed sharply in early September, with two of the three highest volume days occurring between September 2 and September 14. Lower volume days consistently fell in the last third of each week.
What it means
Sending teams appear to concentrate cold outreach around the start of a new month and the early part of the work week, which also means deliverability infrastructure, such as domain warmup and sending limits, faces its heaviest load during the same windows. If your own sends cluster the same way, that is also when a bad list does the most damage to your sender reputation.
Check your own email marketing calendar against this pattern.
What is the Average Email Bounce Rate by Industry 2026?
The average email bounce rate by industry is 25.46%. Once a list has been verified and cleaned, actual bounce rates will be lower when sent because most of the invalid addresses will be removed before the campaign is sent. There can be different bounce risks in different sectors and/or different bounce risks by list source.
To get a more detailed average email bounce rate by industry 2026, check out our Email Data Quality Benchmark Report, which aggregates bounce rate data from multiple sources.
3 Trends Shaping Cold Email Deliverability in 2026
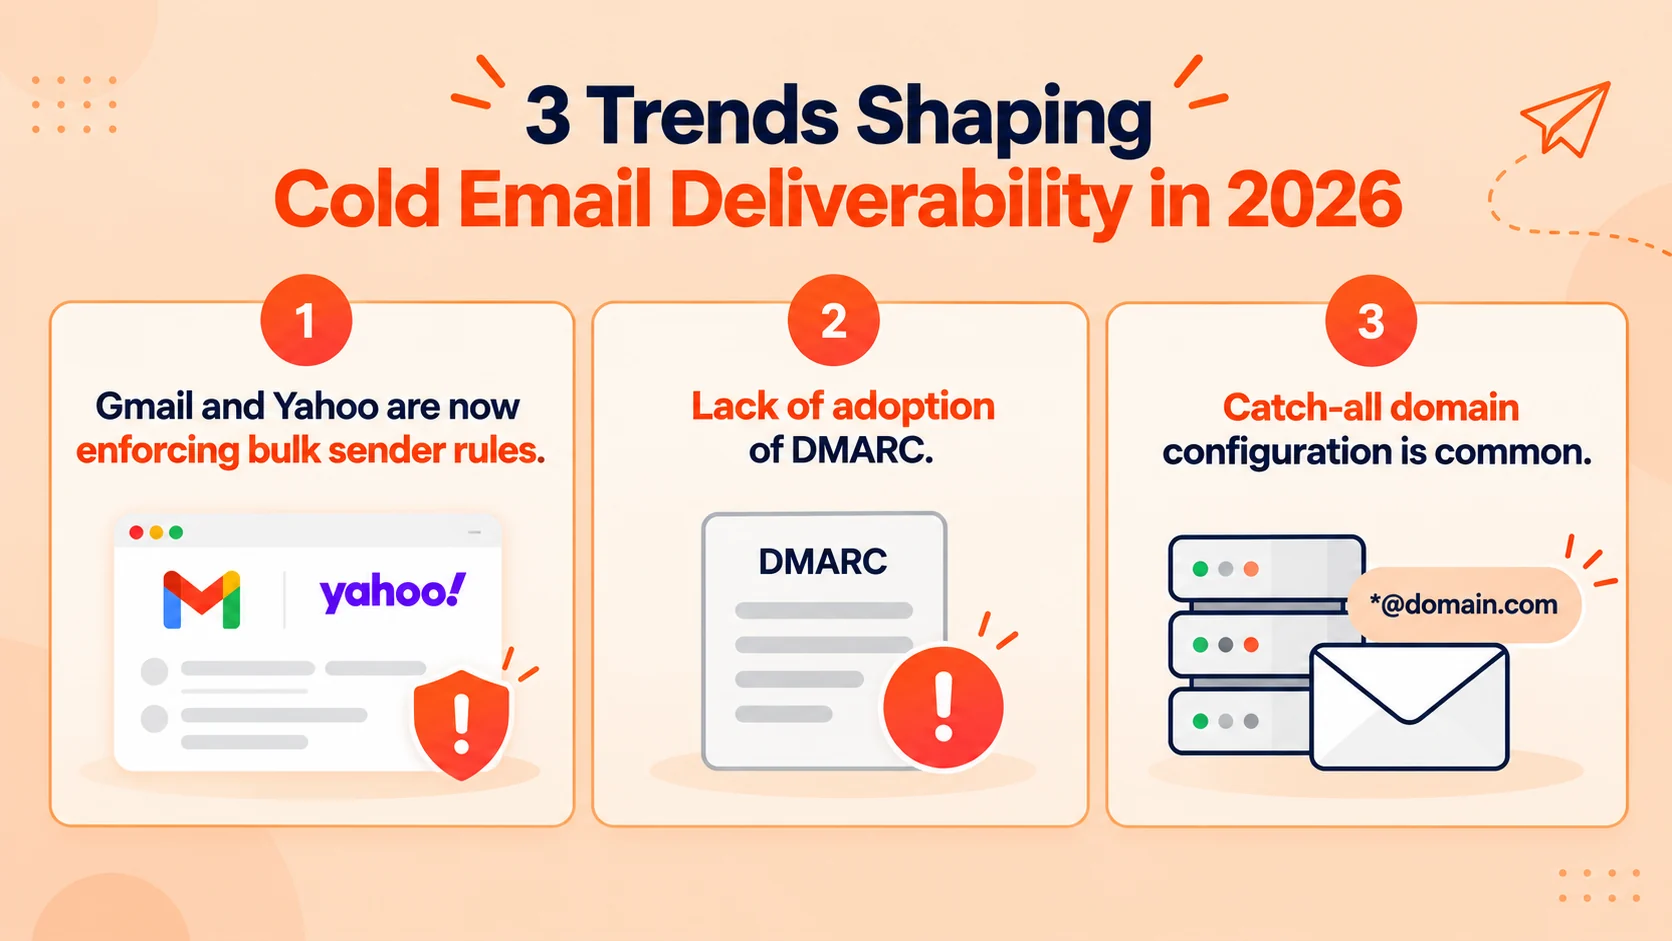
What's new in cold email deliverability in 2026? There are three structural changes that define "good deliverability" for teams doing email marketing this year.
Trend 1: Gmail and Yahoo are now enforcing bulk sender rules.
In early 2024, Google and Yahoo announced the bulk sender requirements and have been adhering to them since 2025 and 2026. They have some basic email authentication measures in place, such as SPF, DKIM, DMARC, a spam complaint rate under 0.10%, and one-click unsubscribe options on every marketing email you send.
Any sender whose spam complaint rate exceeds 0.30% is subject to domain-level filtering. This is no longer a suggested guideline. It is an enforcement condition that has measurable impacts on inbox placement.
Trend 2: Lack of adoption of DMARC.
Even with the enforcement campaign, many of the sending domains still lack DMARC configuration. A domain with no quarantine DMARC policy can be more susceptible to spamming.
Those senders that don't have a p=quarantine or p=reject policy are taking unnecessary risks to their reputation when sending cold emails.
Trend 3: Catch-all domain configuration is common.
In our dataset 7.71% of addresses were on catch-all domains. These are increasing in the outbound lists as more companies start to tolerate all incoming mail. This gives the false impression of deliverability.
An address using a catch-all domain will NOT hard bounce, but it might soft bounce (arc to a spam folder, unmonitored inbox). Treating "catch-all" addresses as equivalent to valid addresses can exaggerate your reach.
How was this Cold Email Data Report produced?
This section covers our methodology in detail, since the numbers above come from real product usage rather than a survey or a controlled study.
Sample size: 49,029,763 verification records. This counts verification events, not unique email addresses. An address checked more than once in the window is counted each time it was verified.
What is measured vs adjusted: The verification status and safe to send figures in this report are the real, measured numbers from our logs. We did not rescale, smooth, or adjust any of the percentages published here.
Limitations: This dataset reflects Clearout's own customer verification traffic, which skews toward teams already using a verification tool. Unknown results reflect mailbox-level ambiguity at the receiving server, not a confirmed invalid outcome.
Key Takeaways
These cold email deliverability statistics 2026 reveal one thing: there is a clear pattern. In an unverified cold outreach list, only one-third of addresses are actually valid or invalid based on verification results. And one-quarter of addresses never confirm as valid or invalid. This is not a "special case"; it should serve as a baseline for anyone looking for cold email statistics 2026. If your list has bulk email addresses, you will be a victim of your own sender reputation until you use an Email Verifier.
Run your next cold outreach list through Clearout's Email Verifier today
and see where it falls against the benchmarks in this report.
FAQs
Want more industry insights?
Browse our latest research, industry trends, and data-backed insights across data quality, sales, marketing, prospecting.
Read more insights →