clearout
  • Products
    • Email Verifier Verify emails addresses individually, in bulk or through API, with 99% accuracy
    • Email Finder Find individual or bulk emails by entering the person & company name or domain
    • Form Guard IconForm Guard Protect your forms from spam, bots, and invalid submissions with real-time email, phone, and name verification.
    • Prospect SQL/MQL list building with high levels of personalization, real-time data enrichment and prospect search
    • Clearout For SheetsVerify email addresses directly on Google Sheets with Clearout for sheets add-on
    • Prospect – LinkedIn Chrome ExtensionBuild verified, targeted prospect lists directly from LinkedIn profiles
    • ClearoutPhoneValidate phone numbers across 240+ countries in bulk, quick or real time validation
    • Free Tools
    • Disposable Email Checker
    • Reverse LinkedIn Profile Lookup Tool
    • Reverse Email Lookup Tool
    • Email List Cleaner
    • Company Domain Finder API
  • Resources
      DEVELOPERAPI iconAPI
      Clearout APIs are structured around REST and JSON
      Webhooks iconWebhooks
      Capture real-time events in your application workflow
      Form Guard iconForm Guard
      Real-time form validation to keep bad contacts out of your CRM
      KNOWLEDGE BASEGetting started iconGetting started
      Sending campaigns without bounces is made simple
      FAQ iconFAQ
      Easily find answers to services, security and common questions
      USE CASESLead Generation iconLead Generation
      Learn how professionals generate quality leads
      GUIDESPricing arrow iconTransparent & flexible pricing to support pay-per-use or recurringCompare Email Verification Tools arrow iconAI-powered email verification with 99%+ accuracy, real-time validation, and transparent risk scoringCompare Email Finder Tools arrow iconPre-verified B2B email addresses with confidence scoring, find real person email, not role-based addressBLOGSEmail Verification ToolsFind Anyone’s Email Address
      Most Accurate, Fast & Free Ways
      Form Validation
      Importance, Ways & Best Practices
      View All Blogs
  • Pricing
  • Integrations
  • Enterprise
  • Login
Try it free Book a 1-to-1 demo
Priyanshi Sharma / June 4, 2026 June 4, 2026

Sales Funnel Metrics & KPIs You Must Track in 2026


Sales Funnel Metrics & KPIs You Must Track in 2026

If you've spent a couple of years in sales, you've probably wondered which metrics you should actually be tracking. That's where sales funnel metrics help.

Sales funnels lose about 70% of leads just after the first interaction with email signups. However, if the funnel metrics are monitored properly and acted upon, you can take more leads to the next stages.

Rather than looking at every KPI at once, they give you a way to measure performance step by step. Hence, in this guide, we have included sales funnel metrics to track and also explained it with a D2C skincare brand example.

Table of Content


‣ What are sales funnel metrics and KPIs?
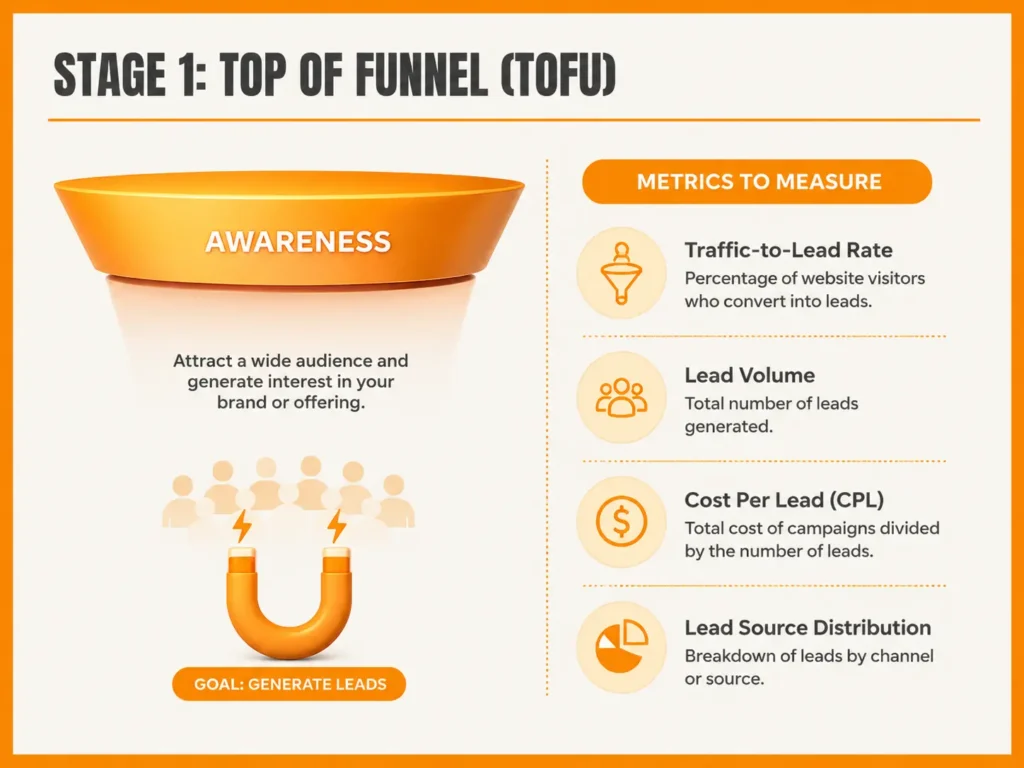
‣ Stage 01: Top of funnel
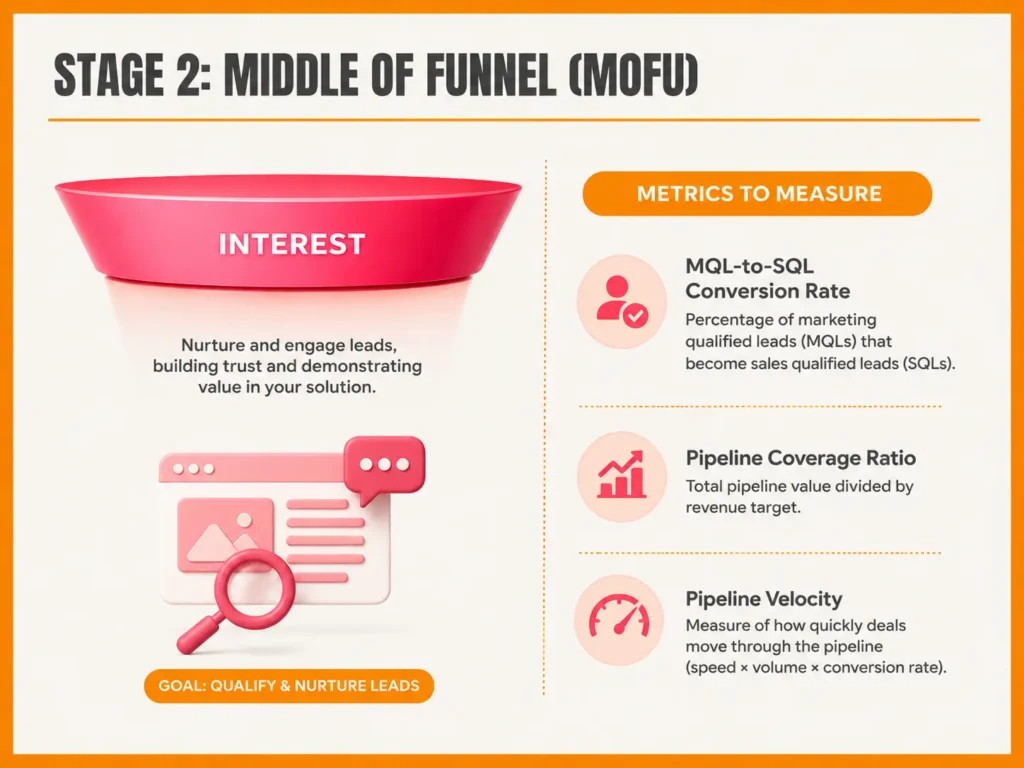
‣ Stage 02: Middle of funnel
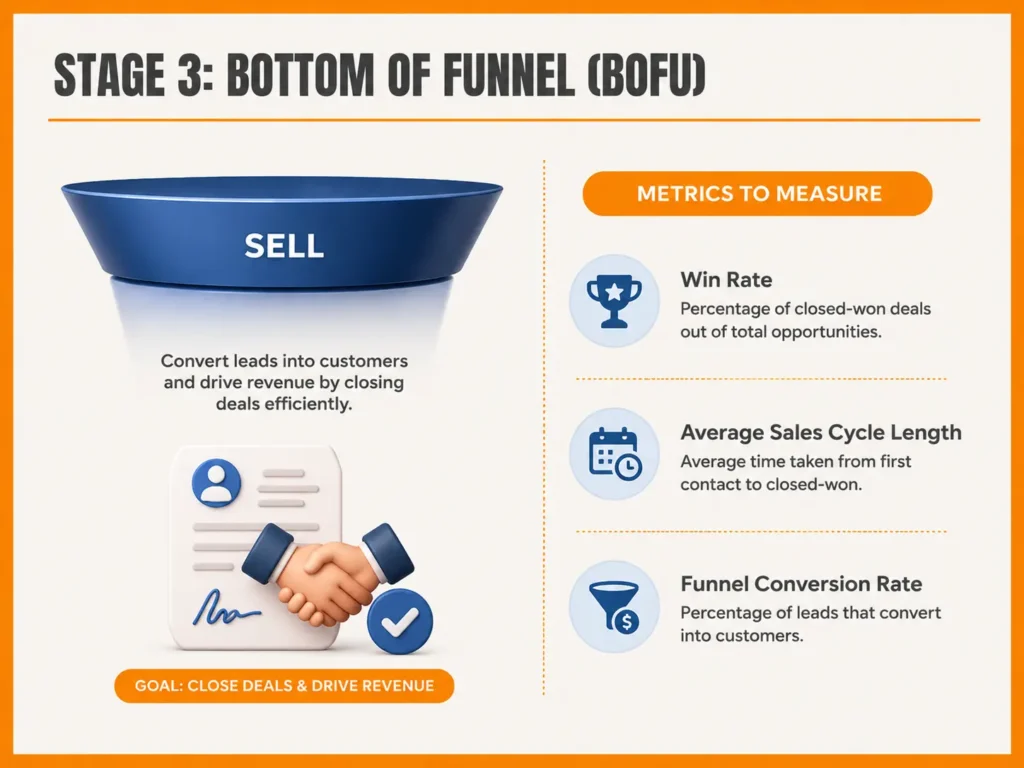
‣ Stage 03: Bottom of funnel
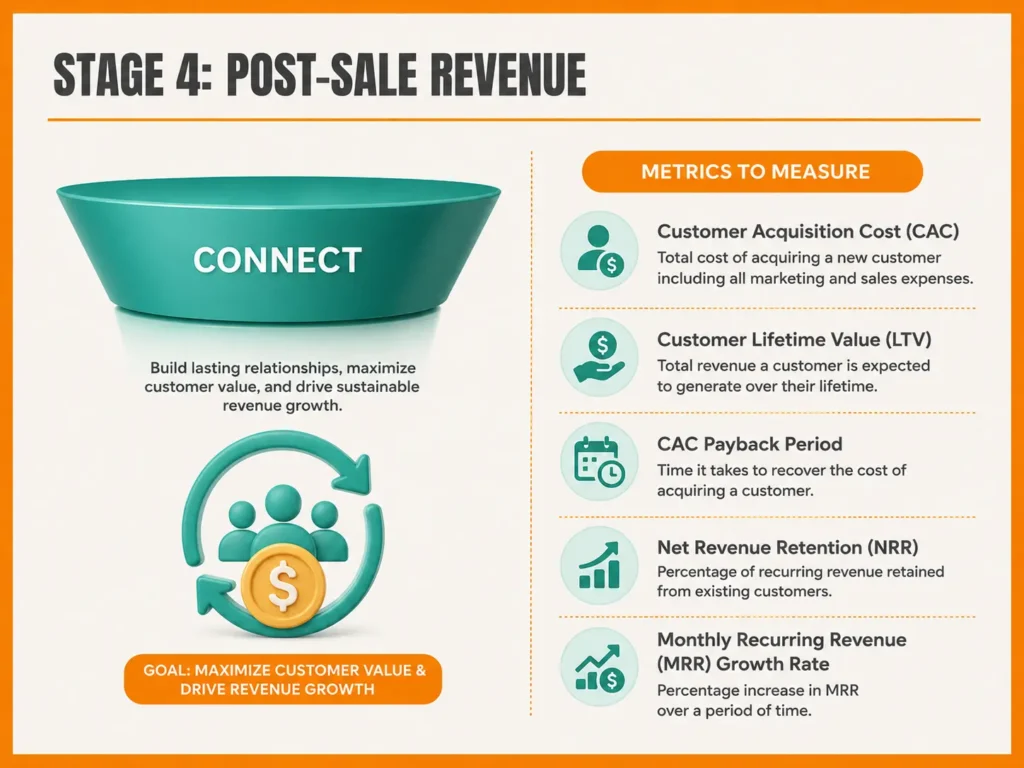
‣ Stage 04: Post-sale revenue
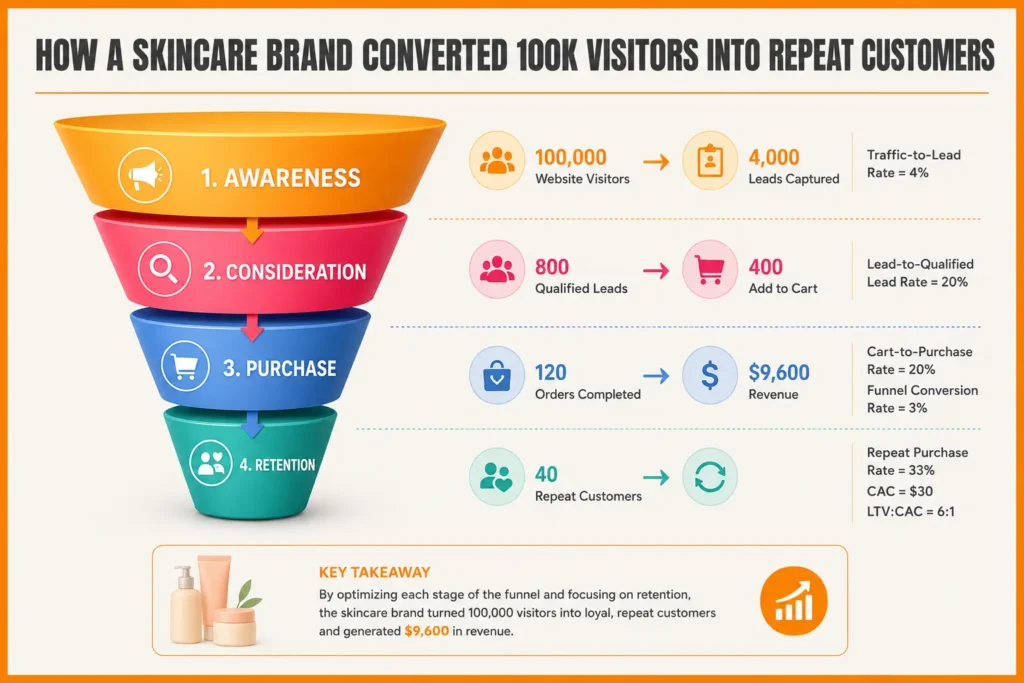
‣ Sales funnel metrics example: How to track performance at every funnel stage?
‣ What do healthy sales funnel metrics look like?
‣ How to track sales funnel performance metrics?
‣ What to do to improve sales funnel metrics?
‣ FAQs

What are sales funnel metrics and KPIs?


Sales funnel metrics are numbers that show and record your prospects' passage through every stage of your sales funnel, from where they first become aware to where they close in on revenue. They let you know where leads go in, where they go out, and how well your sales and marketing funnel is performing at turning leads into sales.

KPIs (Key Performance Indicators) are a subset of metrics that directly signal progress toward a revenue target. Not every metric is a KPI. For example, the number of cold emails sent is a metric. The reply rate from those emails is a KPI because it indicates pipeline creation potential.

The distinction matters because tracking too many metrics dilutes focus. The goal is to identify the small number of indicators that, when they move, move revenue with them.

Key concept

Funnel stages vary by company, but the measurement logic is consistent: measure volume entering each stage, conversion rate between stages, and velocity through stages. These three numbers reveal everything about funnel health.

All sales funnel stages from awareness to selling.

Stage 1: Top of funnel


Awareness and lead generation metrics


Top-of-funnel metrics you should measure


Top of the funnel metrics represent the rate of your awareness building and awareness-to-lead conversion rate. If there's a problem here, then it's likely either a reach, targeting issue or a conversion issue on your entry pages.

Sales metrics to measure at the top of the funnel stage.

What is the traffic-to-lead rate, and how can it be calculated?


It's the first conversion number in any funnel and the maximum cap for all the following conversion numbers.

Formula

Traffic-to-Lead Rate = (New Leads / Total Website Visitors) x 100

What is lead volume?


Lead volume is the raw count of new leads entering your funnel in a given period. It is useful as a trend indicator but dangerous as a standalone goal. High lead volume with poor quality leads wastes SDR capacity and inflates CAC.

Track lead volume alongside lead quality indicators. The ratio between them tells you whether your demand generation is targeting the right Ideal Customer Profile or just generating noise.

  • Traffic-to-Lead Rate
New Leads / Website Visitors × 100

  • Cost Per Lead (CPL)
Total Marketing Spend / Total New Leads

  • Lead Source Distribution
Leads by channel / Total leads × 100

Stage 02: Middle of funnel


Consideration, qualification, and pipeline metrics


What are the mid-funnel metrics?


Mid-funnel metrics cover the qualification and consideration stages, where leads are evaluated for readiness to build a strong sales pipeline. This is the most data-rich part of the funnel and where most revenue optimization opportunities sit. Pipeline metrics for a healthy sales funnel are almost entirely defined by what happens in this zone.

Sales metrics to measure in the mid funnel stage.

What is the MQL-to-SQL conversion rate and what does it reveal?


The MQL-to-SQL conversion rate is directly correlated to the quality of the marketing leads and the expectations of sales.

Benchmark: Less than 15% consistently indicates either poor fit leads are being sent by marketing or there is a lack of understanding between sales and marketing about what constitutes a “good fit.”

An MQL-to-SQL rate of less than 15% is not necessarily a lead quality issue. It's generally a lack of understanding about or a missing lead scoring definition between the marketing team and the sales team.

What is pipeline velocity and how to calculate it?


Pipeline velocity measures how quickly revenue moves through your pipeline per day. It combines four variables into one number and is the most complete single indicator of mid-funnel health.

Improving any one of the four inputs improves pipeline velocity. This is why velocity is more actionable than pipeline coverage alone. You can improve velocity by adding qualified deals, improving win rate through better sales enablement, increasing deal size through expansion plays, or compressing cycle length by multi-threading earlier.

MetricFormulaBenchmark / Target
MQL-to-SQL Rate(SQLs ÷ MQLs) × 100B2B SaaS Benchmark: 20–30%
Pipeline Coverage RatioPipeline Value ÷ Revenue TargetHealthy Minimum: 3× Target
Pipeline Velocity(Number of Deals × Win Rate × ACV) ÷ Sales Cycle DaysHigher velocity indicates faster revenue generation

Track week-over-week trend. The most common mistake in sales funnel analysis is treating the pipeline as a single number. It is a sequence of conversion rates.

Stage 03: Bottom of funnel


Decision, close, and conversion metrics


What are the bottom-of-funnel metrics that determine win or loss?


Bottom-of-funnel metrics measure what happens once a deal is in active evaluation. These are the metrics that directly explain why you win and lose. They are also the hardest to fix quickly, because they reflect the cumulative quality of every upstream decision.

Sales metrics to measure in the bottom of the funnel stage.

What is the win rate and how to calculate it?


Win rate is the percentage of sales opportunities that close as won. It is a direct indicator of sales process effectiveness, competitive positioning, and ICP quality.

Formula

Win Rate = (Closed Won Deals / Total Closed Deals) x 100

What is average sales cycle length?


Average Days to Close is the median days from opportunity creation to close.

Formula

Sales Cycle Length = Sum of Days to Close (all deals) / Number of Deals

Deals above $50k ACV run 60-120 days and if longer than your historical average shows a missing stakeholder.

A deal that is 2x longer than your median cycle is not just slow. It is telling you something is wrong: a champion without internal authority, a missing business case, or a competitor who got to the economic buyer before you did.

How to calculate the sales funnel conversion rate?


The ratio of sales funnel is the percentage of leads that make it from the top of your sales funnel to the bottom, or from leads to clients. Calculated end-to-end and is a composite health indicator.

Formula

Funnel Conversion Rate = (Closed Won Deals / Total Leads Generated) x 100

B2B benchmark: Higher rates (5%+) do not necessarily mean a lot of volume at the top of the funnel, but rather a tight contoured inbound channel. Do not optimize this metric alone, because it can be inflated simply by reducing lead volume at the top.

MetricFormulaBenchmark
Win Rate(Closed Won ÷ Total Closed Deals) × 100B2B SaaS: 20–30%
Sales Cycle LengthTotal Days to Close ÷ Number of DealsEnterprise: 60–120 days
Funnel Conversion Rate(Closed Won ÷ Total Leads) × 100B2B Benchmark: 1–3%

Stage 04: Post-sale revenue


Retention, efficiency, and growth metrics


What are the post-sale metrics?


Post-sale metrics determine if the customers that your funnel brings in stay, grow, and make more money than the funnel cost you to acquire. These are the metrics you need to know to know if your GTM motion is sustainable at scale.

What is Customer Acquisition Cost (CAC) and how to reduce it?

What is Customer Acquisition Cost (CAC) and how to reduce it?


CAC is the metric to check the efficiency of your funnel and the lower portion of your LTV:CAC ratio.

Formula

CAC = Total Sales + Marketing Spend / Number of New Customers Acquired

Benchmark: LTV:CAC should be 3:1 or more. CAC payback period should be less than 12 months. Above 18 months shows that you're staking growth capital for extended periods without benefit.

What Is Customer Lifetime Value (LTV)?


LTV can be used to check if you're spending too much to acquire individuals who aren't generating enough value before leaving.

Formula

LTV = Average Revenue Per Account (ARPA) x Average Customer Lifetime

Key insight

LTV is determined upstream. The quality of customers your funnel attracts sets the ceiling for LTV. A low LTV is often a targeting and ICP problem.

MetricFormulaBenchmark / Target
CAC(Sales Spend + Marketing Spend) ÷ New Customers AcquiredTarget 3:1 or higher
LTVARPA × Average Customer LifetimeShould increase with ICP refinement
CAC Payback PeriodCAC ÷ Monthly Recurring Revenue (MRR per Customer)Strong: Less than 12 months

What are the key SaaS sales funnel metrics you should track?


Two extra layers are added to SaaS metrics, compared to the traditional transactional business, that refer to recurring sales and retention metrics. These are indicative of the compounding nature of the subscription model.

What is Net Revenue Retention (NRR) and why is it a funnel metric?


NRR measures the percentage of revenue generated from existing customers' re-engagement with the business over a time period (excluding contraction, churn and expansion). It is the most important single indicator of SaaS GTM quality in 2026.

Formula

NRR = (Starting MRR + Expansion MRR - Churned MRR - Contraction MRR) / Starting MRR x 100

NRR below 100% is a funnel problem disguised as a customer success problem. It means you are attracting customers for your top-of-funnel ICP targeting who will not remain.

What is the Monthly Recurring Revenue (MRR) growth rate?


For growth-stage companies, it is monitored alongside NRR to separate new customer growth from expansion growth.

Formula

MRR Growth Rate = (Current Month MRR - Previous Month MRR) / Previous Month MRR x 100

Sales funnel metrics example: How to track performance at every funnel stage?


A four-stage sales funnel infographic breaking down key conversion metrics and revenue.

Let's understand with an example. The average order value of a brand's product is $80 and the product they sell is a skin care product. Here's what their visitors looks like.

  • Website Visitors: 100,000
  • Leads Captured: 4,000

Traffic-to-Lead Rate: 4,000 ÷ 100,000 × 100 = 4%

If this drops to 1%, then you have a problem:

  • weak offer
  • poor landing page
  • wrong traffic

So, at this stage, focus on:

  • Traffic
  • Traffic-to-Lead Rate
  • CPL

The marketing team passes 4,000 leads to the retention team.

Out of those:

  • 1,200 open emails regularly
  • 800 click product pages
  • 400 add products to cart

From 400 carts:

  • 120 orders completed
  • Funnel Conversion: 120 ÷ 4,000 × 100 = 3%
  • Revenue: 120 orders × $80 = $9,600

120 customers purchased.

  • After 90 days: 40 purchased again
  • Marketing Spend = $3,600
  • Customers = 120
  • Average Customer Lifetime Value = $180

What do healthy sales funnel metrics look like?


Use this table as a reference to evaluate your own funnel. There is a difference in benchmarks depending on the ACV, sales motion (inbound or outbound) and industry. Use them as directional guides.

B2B SaaS Sales Funnel Metrics Benchmark Reference

MetricFunnel StageStrongAcceptableNeeds AttentionWhat It Signals When Low
Traffic-to-Lead RateTop> 5%2–5%< 1%Messaging or CTA mismatch; wrong traffic source
MQL-to-SQL RateMid> 30%20–30%< 15%ICP mismatch or undefined lead scoring criteria
Pipeline Coverage RatioMid4–5× target3× target< 2.5×Insufficient pipeline for reliable forecasting
Win RateBottom> 30%20–30%< 15%Competitive positioning gap or qualification failure
Sales Cycle (SMB)Bottom< 30 days30–60 days> 90 daysMissing champion, stalled evaluation, or late multi-threading
Funnel Conversion RateBottom> 3%1–3%< 0.5%Compound drop-off across multiple funnel stages
LTV : CAC RatioRevenue> 5:13:1–5:1< 3:1CAC too high or churn reducing LTV below threshold
CAC Payback PeriodRevenue< 12 months12–18 months> 18 monthsExpensive acquisition or high early churn
Net Revenue RetentionRevenue> 115%100–115%< 90%Wrong-fit customers entering the funnel upstream

(Benchmarks reflect B2B SaaS median ranges. Adjust for your ACV tier, sales motion, and industry vertical.)

How to track sales funnel performance metrics?


Most teams fail at funnel measurement not because they lack data but because they track too much of it without a clear hierarchy. The result is a dashboard nobody acts on. Here is how to build a measurement system that works.

  • Set thresholds for what should be "healthy," "watch," and "fix immediately" for each core metric before a crisis creates urgency.
  • Build a single shared dashboard. Sales and marketing reviewing different numbers in different tools is the structural root of misalignment. One dashboard, one truth.
  • Separate operational and strategic review cadences. Pipeline velocity and stage conversion rates get weekly attention. CAC, LTV, and NRR get monthly executive reviews.
  • Document your response playbook. When MQL-to-SQL drops below 15%, what specifically happens? Who does what by when? Without this, metrics become observation without action.

How to use sales funnel metrics to find where the funnel is leaking?


Answer these questions to understand the health of your funnel. Is the drop-off consistent across all lead sources, or does it spike for specific channels? Is it worse for certain rep segments? Does it correlate with deal size? Segmentation turns a symptom into a root cause.

On Data Quality


Sales funnel metrics must be accurate enough otherwise your conversion rates will be calculated wrong. Your CRM should have duplicate contacts, mismapped stages, or outdated firmographics. For teams using LinkedIn as a prospecting channel, email accuracy compounds this problem.

Clearout's real-time email verification makes sure that contact data entering your CRM is clean and deliverable from the first touchpoint, which protects the accuracy of every downstream metric from CPL to CAC.

What to do to improve sales funnel metrics?


Before you obsess over CPL, CAC, or conversion rates, take a look at the data feeding those numbers. If invalid emails and bad-fit leads are there in your CRM, your attribution and conversion data won't accurately show performance.

That's why cleaning your data early is important. With Clearout, you can verify emails before they enter your funnel, cut down on junk records, and get a much clearer picture of what's actually working.

Improve sales metrics with a better data quality


Verify Emails Instantly

FAQs


1. What are the most important metrics to measure sales funnel success?
The most important metrics to measure sales funnel success are: MQL-to-SQL conversion rate, Pipeline Coverage Ratio, Win Rate, CAC Payback Period, and Net Revenue Retention Tracking these five gives you visibility across every stage without dashboard overload.
2. What are the key B2B sales funnel metrics for evaluating sales funnel performance?
For B2B, the key metrics to evaluate sales funnel performance are Traffic-to-Lead Rate (top), MQL-to-SQL Rate and Pipeline Coverage (middle), Win Rate and Average Sales Cycle Length (bottom), and LTV:CAC and NRR (post-sale). B2B funnels involve longer cycles and multiple decision-makers. So Pipeline Coverage Ratio and Sales Cycle segmentation by deal size are especially important.
3. What are the best SaaS sales funnel metrics to track in 2026?
For SaaS in 2026, prioritize: MQL-to-SQL Rate, Pipeline Velocity, Win Rate, CAC Payback Period, Monthly Recurring Revenue Growth Rate, and Net Revenue Retention. NRR is the most important SaaS-specific metric because it measures whether your GTM motion is attracting customers who stay and expand.
4. What are marketing sales funnel metrics and how are they different from sales metrics?
Marketing funnel metrics focus on the top and middle stages: traffic, lead volume, CPL, Traffic-to-Lead Rate, MQL volume, and MQL-to-SQL conversion. Sales metrics focus on the bottom stages: Win Rate, Sales Cycle Length, and Average Deal Size. The boundary metric between both functions is the MQL-to-SQL conversion rate, which is why it is the most important shared KPI for aligned revenue teams.
5. What are some sales funnel metrics examples for a pipeline health review?
In a pipeline health review, the most useful sales funnel metrics examples to cover are: Pipeline Coverage Ratio (do we have enough to hit target?), Pipeline Velocity (how fast are deals moving?), Stage Conversion Rates (where is the biggest drop-off?), Average Age of Open Opportunities (are deals stalling?), and Win Rate by deal size segment (where do we win and lose?). These five together give a complete picture of funnel health in a 30-minute review.

Share this article

Recent Posts

04 Jun 2026
Sales Funnel Metrics & KPIs You Must Track in 2026

Discover the sales funnel metrics in 2026, including MQL-to-SQL rate, pipeline velocity, CAC, conver ...

02 Jun 2026
Top 11 LinkedIn Automation Tools in 2026 (By Use Case)

Explore the top LinkedIn automation tools of 2026 for prospecting, outreach, content and workflow au ...

29 May 2026
Email Verification for Startups vs Enterprises: What Changes at Scale

Explore startup vs enterprise email verification as businesses scale. Learn how requirements differ ...

22 May 2026
8 Best Email Tracking Tools in 2026

Discover the 8 best email tracking tools in 2026 for Gmail, Outlook, and team performance tracking. ...

21 May 2026
How Fake Form Submissions Are Wasting Your PPC Budget

Fake form submissions inflate CPL, and waste your PPC budget. Discover how to block spam form submis ...

Clearout's

Form Guard

Validate email, phone & name on any forms!

  • Real signups only
  • Verified emails
  • Valid phone numbers
  • No fake names
  • Cleaner CRM
  • No devs needed
Try for Free Now

Email Verification, Email Finding Form Guard & Prospecting Service

Expand Your Reach By Finding & Verifying Ideal Prospects.

Sign up & get 100 free credits

No Credit Card required

Create Free Account
Company

Why Clearout?

Pricing

Contact Us

Careers

Press

Enterprise

Sitemap

FAQ

Status

Products

Email Verifier

Email Finder

Form Guard

Prospect

LinkedIn Email Finder

Reverse Lookup

Google Sheets Add-on

WordPress Plugin

ClearoutPhone

What's New?

Resources

Integrations

HubSpot

Team Account

API

Compare Email Verifier

Compare Email Finder

Compare Prospecting

Use Cases

Blog

Help

Legal

Privacy Policy

Terms

DPA

Security

Trust Center

Certification

ISO 27001/2022

SOC 2 Type 2

GDPR

Partnership

HubSpot Certified

Affiliates

Partners

Clearout for browser

⚡ Supercharge Your Prospect Research with Clearout's LinkedIn Chrome Extension - Find and Verify Emails with Confidence!

Clearout Chrome extension

clearout
© 2026 Clearout Inc. All Rights Reserved. Powered by Clearout.
Auto Credit Replenishment is here! Your credits can now recharge automatically. Learn More ➞
X