- Products
- ResourcesDEVELOPER

 API
API
Clearout APIs are structured around REST and JSON Webhooks
Capture real-time events in your application workflow Form Guard
Real-time form validation to keep bad contacts out of your CRMKNOWLEDGE BASE Getting started
Sending campaigns without bounces is made simple FAQ
FAQ
Easily find answers to services, security and common questionsUSE CASES Lead Generation
Learn how professionals generate quality leadsGUIDESPricing Transparent & flexible pricing to support pay-per-use or recurringCompare Email Verification Tools AI-powered email verification with 99%+ accuracy, real-time validation, and transparent risk scoringCompare Email Finder Tools Pre-verified B2B email addresses with confidence scoring, find real person email, not role-based addressData Pulse & HubSpot Breeze Intelligence Pre-verified B2B email addresses with confidence scoring, find real person email, not role-based addressBLOGSEmail Verification ToolsFind Anyone’s Email Address
Most Accurate, Fast & Free WaysForm Validation
Importance, Ways & Best PracticesView All Blogs - Pricing
- Integrations
- Enterprise
- Login
13 Go-To-Market Metrics to Track Across Every Funnel Stage
88% of B2B companies say generating enough pipeline is difficult. A big reason behind this is the obsession with tracking surface-level metrics that look impressive in meetings but reveal very little about actual revenue growth.
And when you track the wrong metrics, your funnel may look healthy on the outside while serious problems quietly build underneath. That’s why tracking the right metrics at the right stage matters so much.
In this guide, we have created a list of GTM metrics with formulas that shouldn't be ignored to have revenue growth.
Table of Content
Top 13 Go-to-market (GTM) Metrics to Track for Business Success
GTM metrics are used to determine if a business's go-to-market initiatives are contributing to pipeline, revenue and customer growth. They identify where the funnel is slowing down, where your high-fit buyers are going, and which part of the funnel is degrading conversion rates without impacting revenue.
They also enable sales, marketing, customer success, and RevOps teams to view the same performance signals rather than disparate dashboards. Many companies miss the point that GTM metrics are not simply just numbers. These are warning signs.
Looking for a healthier pipeline and more predictable revenues? Start tracking the GTM metrics that high-performing revenue teams care about. Here’s a complete breakdown.
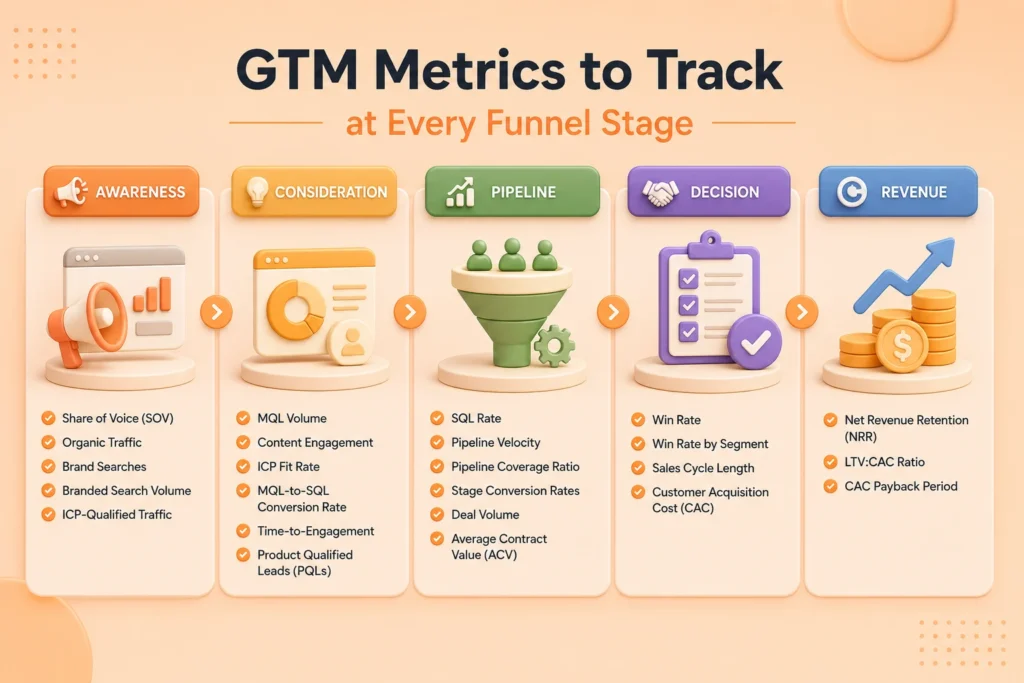
Stage 01: Awareness
What GTM metrics to track at the top of the funnel?
Awareness metrics tell you whether your go-to-market motion is reaching the right people before they're in-market. They're not vanity metrics, but they become vanity metrics the moment you stop segmenting them by ideal customer profile fit. A spike in organic traffic from the wrong persona is noise. The same spike from your target segment is a signal worth acting on.
The most important top-of-funnel go-to-market metrics are mentioned below:
The most important top-of-funnel go-to-market metrics are mentioned below:
Key awareness metrics to track
1. Share of Voice (SOV)
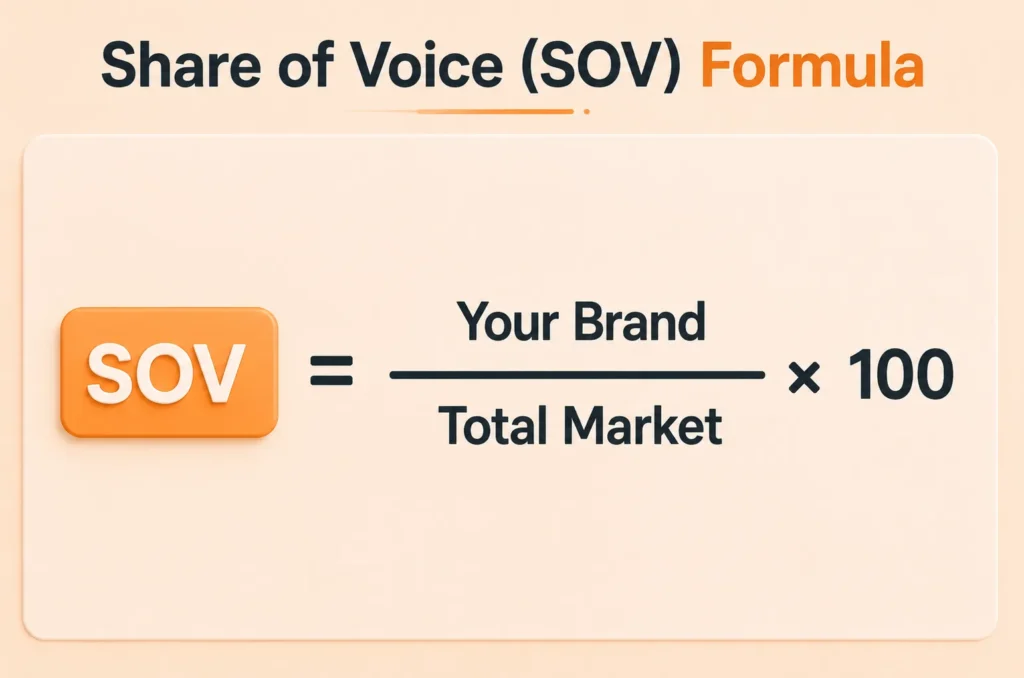
The percentage of category-level mentions, search impressions, or AI citations your brand captures relative to competitors. Rising SOV precedes pipeline growth by 60–90 days in most B2B SaaS categories.
2. Branded Search Volume
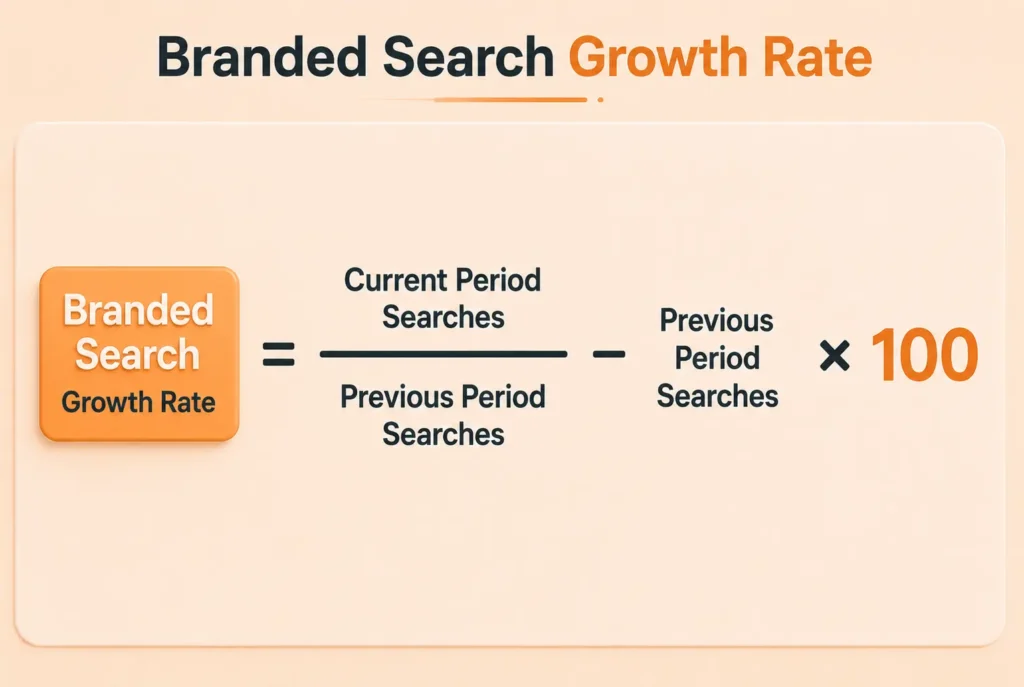
The monthly volume of searches that include your brand name. Growth here indicates that your demand generation is working and creating recall, a critical input to shorter sales cycles later.
3. ICP-Qualified Traffic
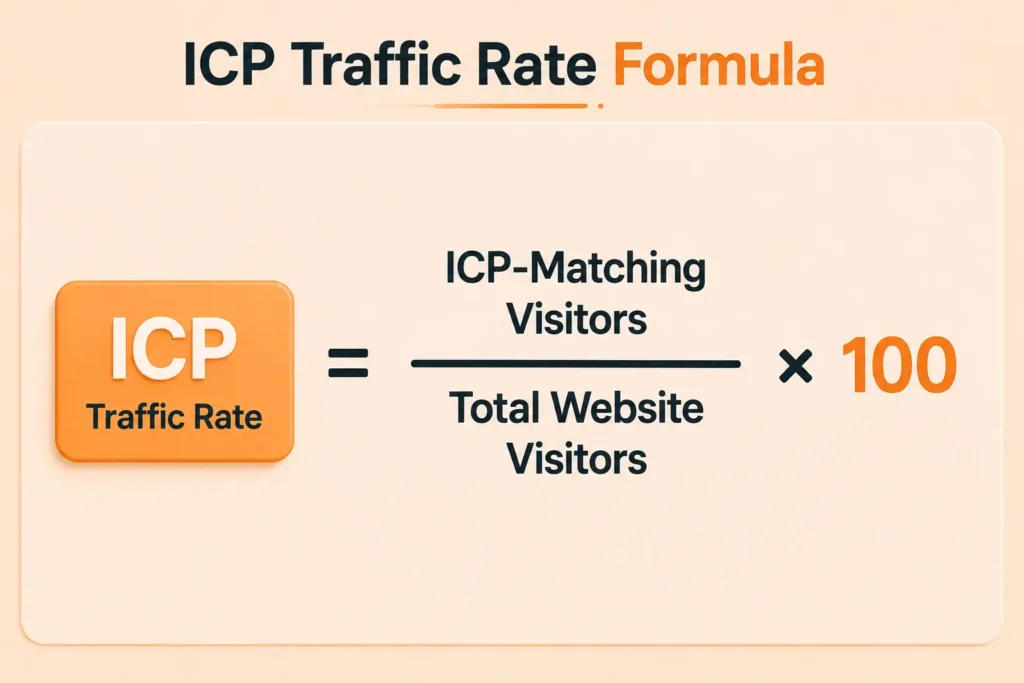
Organic and paid visitors who match your ideal customer profile by firmographic or behavioral signal. This is the number that matters, not total traffic.
Most GTM mistakes do not look serious in the beginning. At first, it is just a few wrong-fit leads or low-quality data in the CRM. But over time, the pipeline slows down, reply rates drop, and revenue teams end up fixing problems much later than they should.
Most GTM mistakes do not look serious in the beginning. At first, it is just a few wrong-fit leads or low-quality data in the CRM. But over time, the pipeline slows down, reply rates drop, and revenue teams end up fixing problems much later than they should.
Stage 02: Consideration
How to measure consideration-stage GTM performance?
This is where most B2B SaaS GTM stage classification metrics go wrong. Teams track MQL volume and declare victory. But volume without quality is just pipeline padding. It keeps the dashboard green while the AE team chases deals that will never close.
4. MQL-to-SQL conversion rate
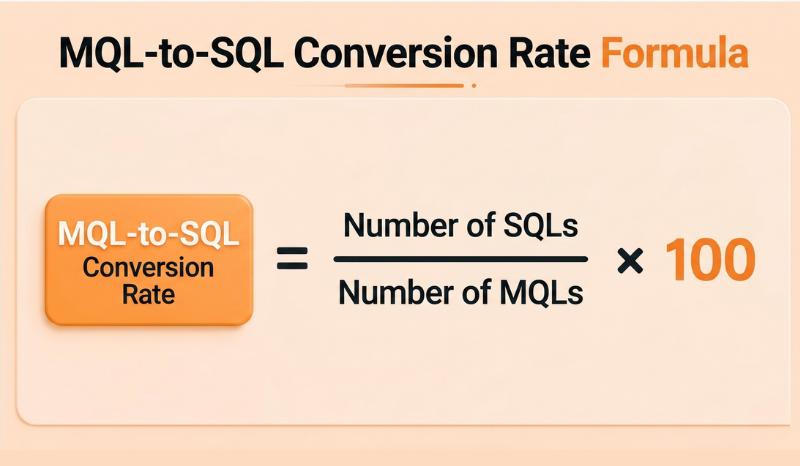
There should be one question to consider when it comes to consideration metrics: are the right people interacting with us and are they progressing? They need to track both the number of MQLs and how many of them convert into SQLs.
It measures engagement of the content rather than pageviews by persona. And it means watching how the ICP fits as a quality gate on everything else: the percentage of leads that fit your ICP.
Time-to-engagement, or the amount of time your sales team takes to reply to an inbound signal, is one GTM metric that teams chronically underuse at this stage.
5. Product Qualified Leads (PQLs)
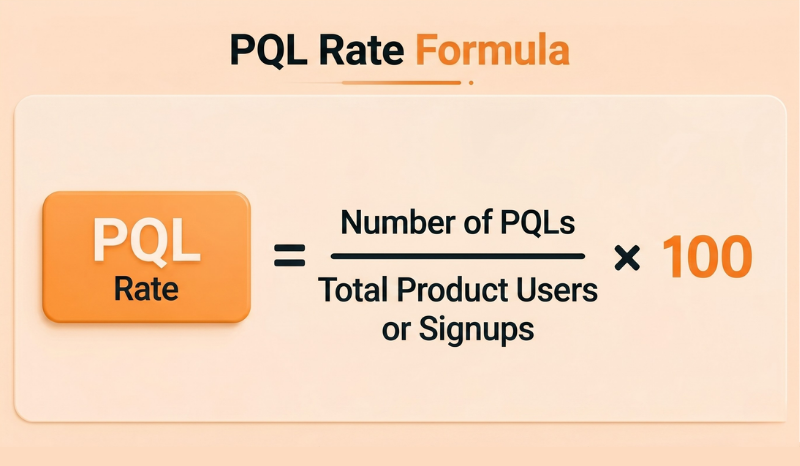
Product Qualified Leads (PQLs) is another important SaaS GTM metric that is gaining popularity. PQLs are users who show buying intent by using the product, such as by hitting key product activation points, inviting teammates, or using features that indicate high potential to purchase. PQLs are now a more reliable measure of conversion prospects as more SaaS buyers move to a self-serve evaluation process.
Studies have consistently demonstrated that response rates of 5 minutes or less can make a huge difference in conversions. However, the real average time for most teams is in the order of hours, not minutes. Honestly monitoring this figure is one of the quickest ways to get more consideration-to-pipeline conversion rates.
Studies have consistently demonstrated that response rates of 5 minutes or less can make a huge difference in conversions. However, the real average time for most teams is in the order of hours, not minutes. Honestly monitoring this figure is one of the quickest ways to get more consideration-to-pipeline conversion rates.
Stage 03: Pipeline
Pipeline metrics: The engine room of GTM performance
Pipeline metrics are where go-to-market strategy effectiveness metrics become most actionable and most visible to leadership. This is the stage where sales and marketing data converge, and where the quality of your upstream decisions shows up as a number in a CRM column.
The 3 pipeline metrics that matter most for B2B SaaS go-to-market strategy metrics are
The 3 pipeline metrics that matter most for B2B SaaS go-to-market strategy metrics are
- Pipeline velocity
- Pipeline coverage ratio
- Stage conversion rates
6. Pipeline coverage ratio
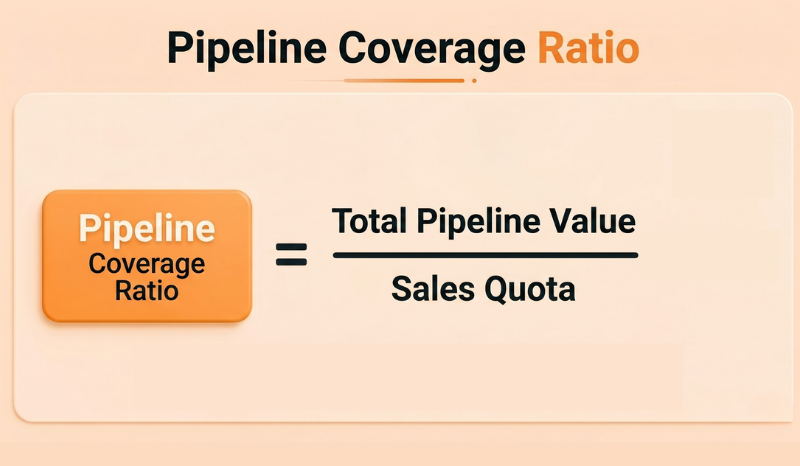
It is the ratio of pipeline value to quota. This ratio is a leading indicator of whether you'll hit the number before the quarter ends. Most high-performing teams target 4× coverage at the start of the quarter; anything below 3× entering the final month creates serious forecast risk.
7. Stage conversion rates
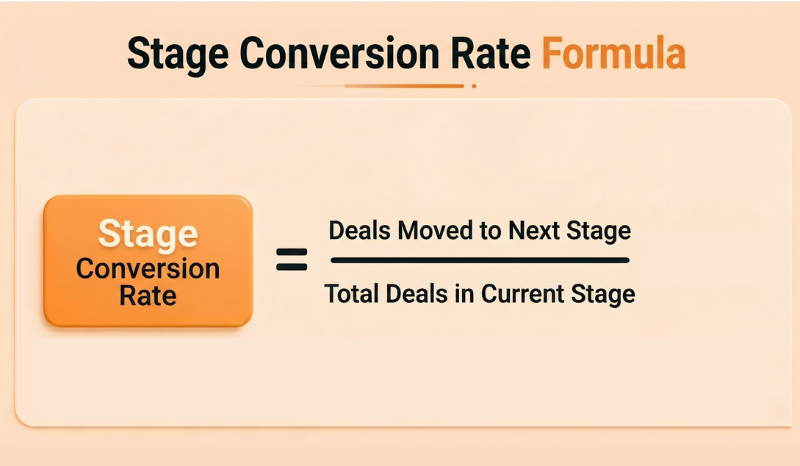
Stage conversion rates measure how efficiently opportunities move through each step of the sales funnel. Strong GTM teams do not just track overall conversion. They monitor conversion between every stage separately because each drop-off point reveals a different operational problem.
Buyers might be missing the target or there is a mismatch in message. When a company has a low Proposal to Close conversion, it indicates pricing issues, positioning issues, or lack of competitive differentiation.
Buyers might be missing the target or there is a mismatch in message. When a company has a low Proposal to Close conversion, it indicates pricing issues, positioning issues, or lack of competitive differentiation.
8. Pipeline velocity
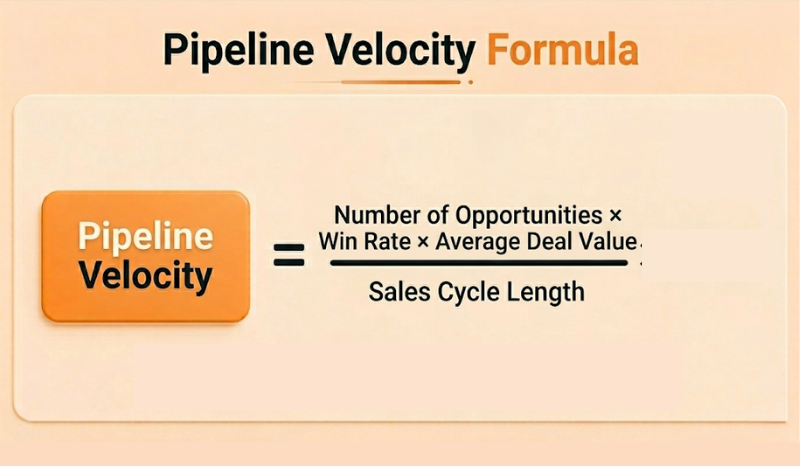
Pipeline velocity measures how quickly revenue moves through the pipeline. It combines four critical GTM variables into a single metric:
- Deal volume
- Win rate
- Average contract value (ACV)
- Sales cycle length
Because it connects both pipeline quality and sales efficiency, pipeline velocity is one of the most diagnostic metrics in a GTM dashboard.
Teams that increase MQL volume without improving win rate or deal value often see little improvement in velocity.
Teams that increase MQL volume without improving win rate or deal value often see little improvement in velocity.
Stage 04: Decision
What GTM metrics to measure in the decision stage?
The go-to-market success metrics that are the most uncomfortable are at the decision stage. Win rate doesn't care about your messaging deck. Your BDR headcount plan is of no concern to sales cycle length.
9. Win rate by segment
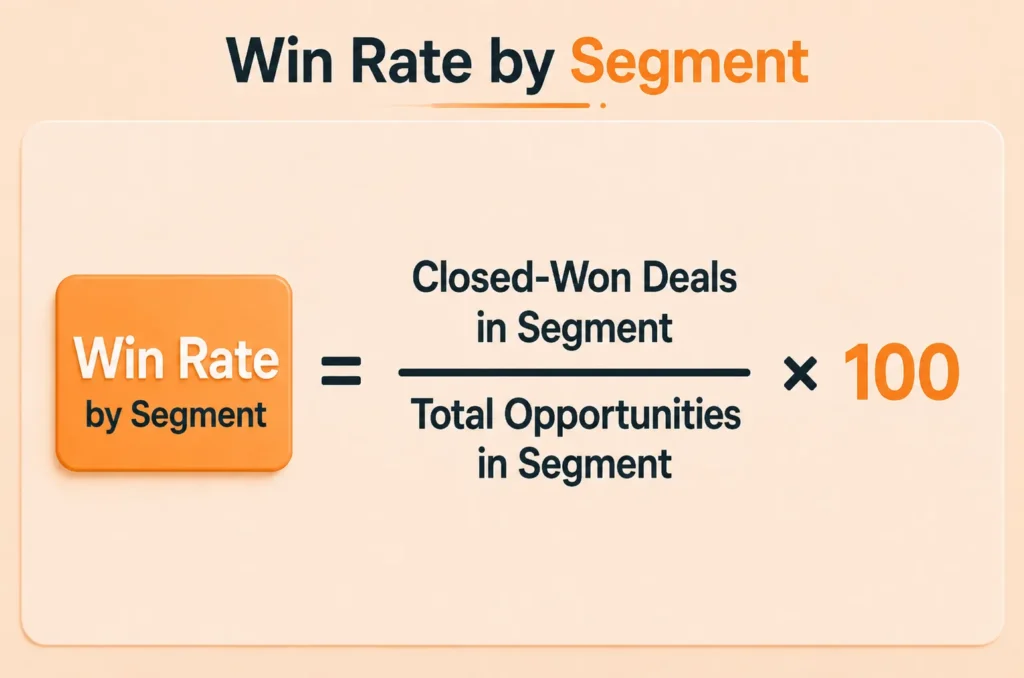
It is more useful than the aggregate win rate. If you're winning 40% against one competitor and 12% against another, it's a competitive positioning problem, and it has a specific fix. Tracking win rate at this level of granularity is how sophisticated GTM teams know where to invest in enablement versus where to improve the product or reframe the pitch.
10. Sales cycle length
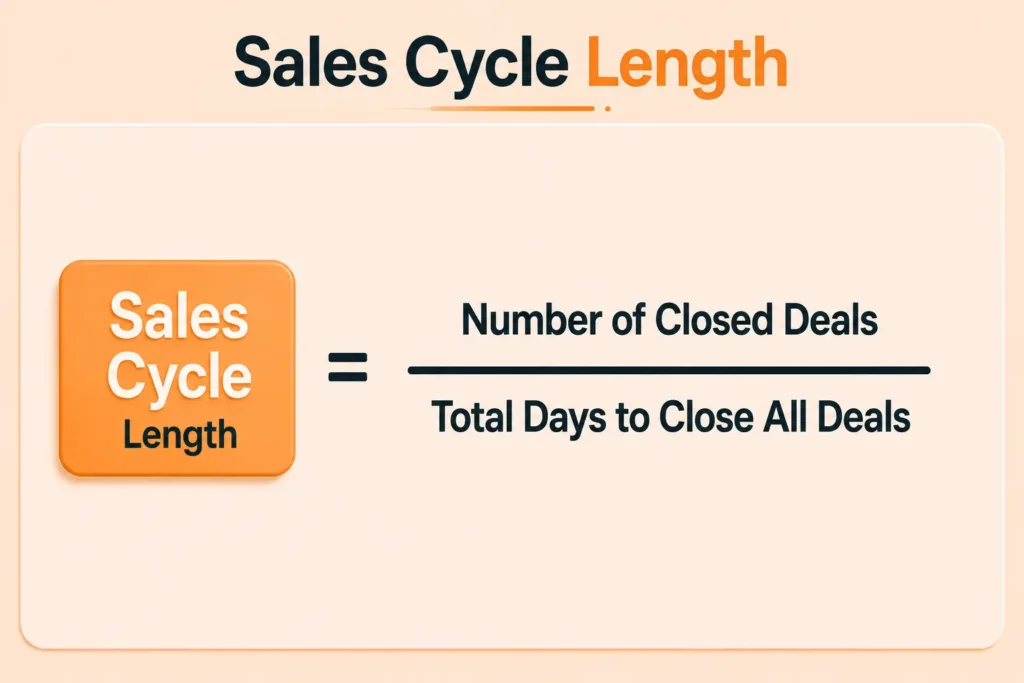
If a deal with your ideal customer is taking twice as long as expected, there’s usually a problem in the sales process. Maybe the right people got involved too late, the business value wasn’t clear enough, or your main point of contact didn’t have enough support internally.
Compress cycle length by identifying the steps where deals consistently slow down, not by pushing harder on every deal uniformly.
Compress cycle length by identifying the steps where deals consistently slow down, not by pushing harder on every deal uniformly.
Stage 05: Revenue
Post-close GTM metrics: Where real go-to-market effectiveness is measured?
Most GTM conversations stop once the deal closes. That’s a mistake, especially for B2B SaaS companies.
The real sign of whether your go-to-market strategy is working shows up after the sale. So, here are the important GTM metrics to track at this stage:
The real sign of whether your go-to-market strategy is working shows up after the sale. So, here are the important GTM metrics to track at this stage:
11. Net Revenue Retention (NRR)
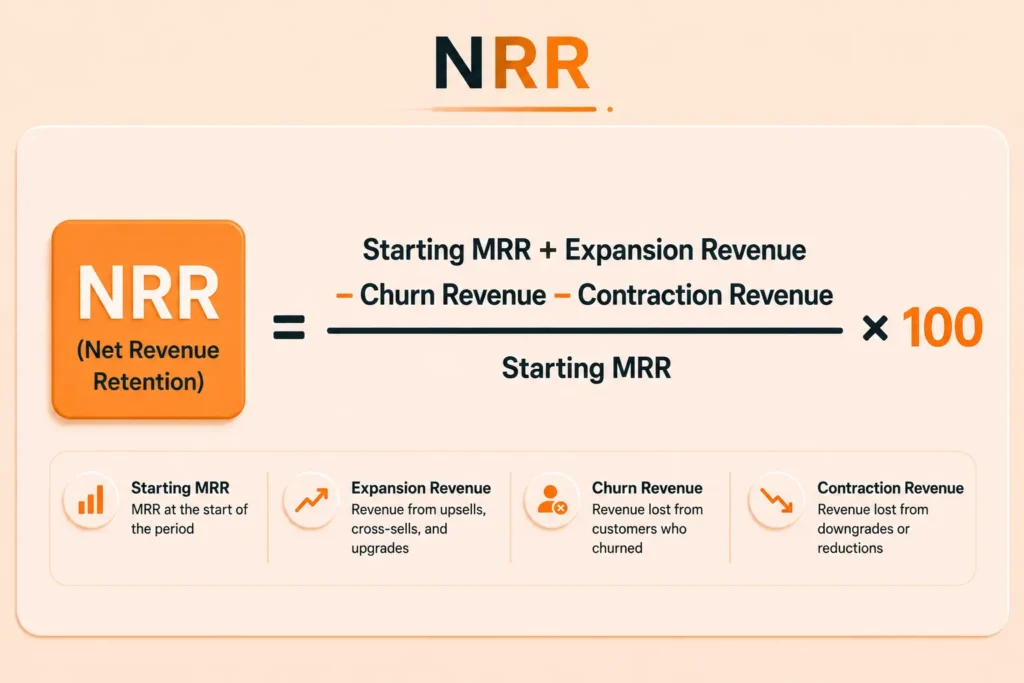
NRR combines expansion revenue, churn, and contraction into one metric. It shows whether the customers your GTM strategy brings in are actually successful long term.
If your NRR is above 100%, your existing customer revenue is growing even if you don’t close a single new customer that month.
It also means your customer acquisition cost is becoming more efficient because revenue from existing customers keeps expanding over time.
If your NRR is above 100%, your existing customer revenue is growing even if you don’t close a single new customer that month.
It also means your customer acquisition cost is becoming more efficient because revenue from existing customers keeps expanding over time.
12. LTV: CAC ratio
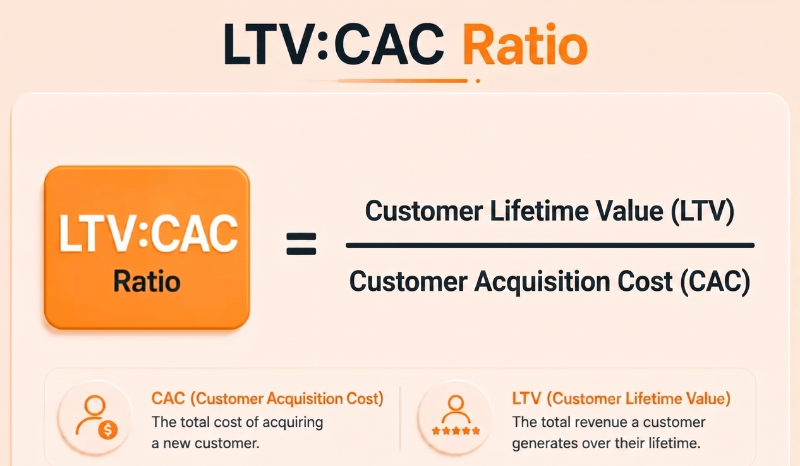
It is the efficiency metric that determines whether your GTM model is sustainable as you scale. A ratio below 3:1 suggests your sales and marketing costs are too high relative to the lifetime value you're generating.
For B2B SaaS companies tracking GTM scaling metrics in 2026, LTV: CAC is the number that investors and board members scrutinize most closely during growth reviews.
For B2B SaaS companies tracking GTM scaling metrics in 2026, LTV: CAC is the number that investors and board members scrutinize most closely during growth reviews.
13. CAC payback period
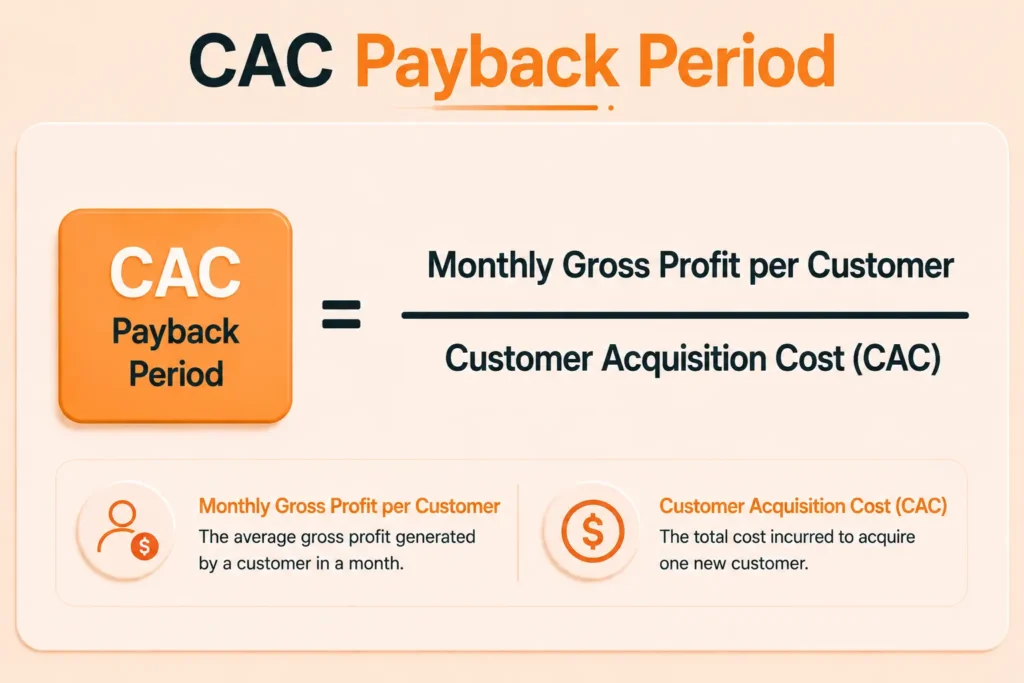
CAC payback is the number of months it takes to recover the cost of acquiring a customer. This GTM metric directly affects how aggressively you can reinvest in growth.
Payback under 12 months gives your GTM team fuel to scale; payback over 18 months means every dollar spent on new customer acquisition sits tied up for a year and a half before it returns anything.
Payback under 12 months gives your GTM team fuel to scale; payback over 18 months means every dollar spent on new customer acquisition sits tied up for a year and a half before it returns anything.
How to track GTM performance metrics without drowning in data?
The real challenge for most revenue teams is that there are too many metrics spread across too many tools. On top of that, there’s often no clear ownership and no shared understanding of what success actually looks like. The solution isn't a bigger dashboard. It's a smaller, better-defined one.
High-performing teams build a single GTM metrics stack, 8–12 metrics covering all five funnel stages, and review them on a consistent cadence.
High-performing teams build a single GTM metrics stack, 8–12 metrics covering all five funnel stages, and review them on a consistent cadence.
Team Checklist
- Assign one owner to each metric
- Define benchmarks for each metric based on your segment and ACV
- Build a single shared dashboard visible to both sales and marketing leadership
- Review pipeline and conversion metrics weekly; strategic metrics monthly
- Tie each metric to a funnel stage so it's clear which team owns the fix
- Audit your CRM data quality quarterly because bad data makes every metric unreliable
- Track trends. A metric moving in the right direction matters more than a single data point
- Document your response playbook: when X drops below Y, we do Z
The bottom line
If not tracked regularly, the GTM metrics are useless. Pipeline velocity, win rate, NRR, CAC payback and stage conversion rates provide clues to where revenue growth is accelerating while the funnel is slowing down.
Meanwhile, poor-quality lead data weakens every GTM metric. Low data quality leads to less conversion, higher CAC and uncertain pipeline forecasts. Clearout makes sure that revenue teams keep accurate prospect data, clean pipelines, and a great GTM performance.
Meanwhile, poor-quality lead data weakens every GTM metric. Low data quality leads to less conversion, higher CAC and uncertain pipeline forecasts. Clearout makes sure that revenue teams keep accurate prospect data, clean pipelines, and a great GTM performance.
Get High-quality GTM data
No credit card required
FAQs
1. Which GTM metrics should you track?
The main GTM metrics that can help achieve success at each stage of the funnel are share of voice and ICP traffic (awareness), MQL-to-SQL conversion rate (consideration), pipeline velocity and coverage ratio (pipeline), win rate and sales cycle (decision), and NRR, LTV: CAC, and CAC payback (revenue). Work on one metric at a time and add on.
2. How do you track GTM performance metrics effectively?
You must use a common dashboard to track GTM performance metrics and have one individual become the owner of each metric. This can be done weekly for pipeline metrics or monthly for strategic metrics. Most important of all, list the action that each metric takes when it exceeds the limits.
3. What are the most important B2B SaaS GTM scaling metrics?
B2B SaaS companies can focus on pipeline velocity, NRR, CAC payback period (growth capital efficiency), and share of voice in AI answer engines as the most important GTM metrics. These four together provide you with the best indicator of the health of your GTM motion for scaling.
4. What are the necessary tools for GTM to get high-quality data?
A modern GTM data stack requires accurate prospecting, email verification, phone validation, and CRM management to perform efficiently. You can use Clearout to get high-quality data and keep contacts clean, improve outreach quality, and build a healthier pipeline from the start.